pH APP
pH of a mixture
pH of mixture is aimed at calculating the pH of an aqueous mixture
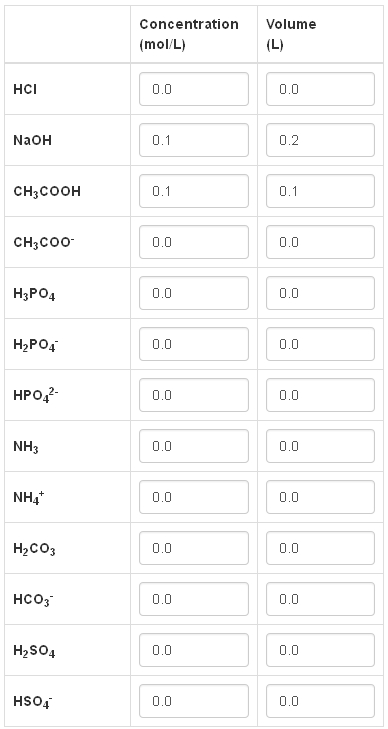
In the table, several solutions are given.
Enter the initial solution, to obtain the pH of the mixture.
Click on the button “pH =”, to obtain the final pH.
The calculated pH corresponds to the solution, that has been obtained by mixing the solutions selected from the table.
Here below, an example. We have chosen to mix two solutions:
0.1 L of a solution of 0.1 mol/L CH3COOH and
0.2 L of a solution 0.1 mol/L NaOH
The pH obtained is then equal to:

We can add an acid (or a base), that is not given in the table, by clicking on the corresponding button
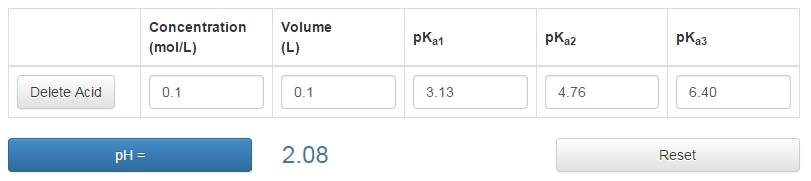
If we choose a triprotic acid, we will click on the following button:

and enter the values of concentration, volume and pK.
Let’s consider, for instance, a 0.1 mol/L solution of citric acid; the corresponding pH is calculated:
Titration Curves
Titration curves allows to trace the pH curve of an aqueous mixture.
Let’s do an example. We wish to titrate a 0.1 mol/L solution of CH3COOH.
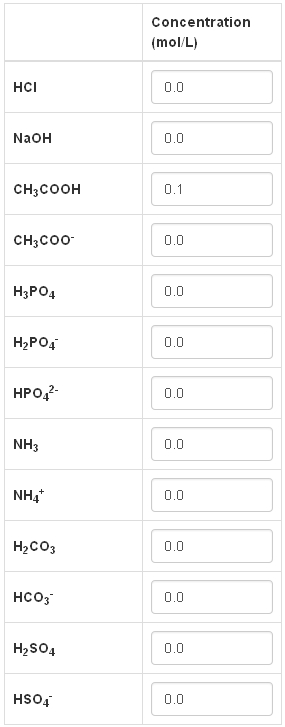
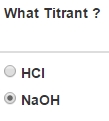
The selected titrant is a strong base.
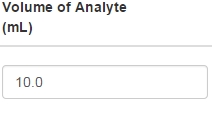
Volume of Analyte is equal to 10 mL.
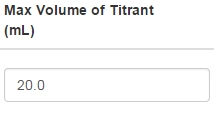
Titration will stop when Titrant Volume will be equal to 20 mL.
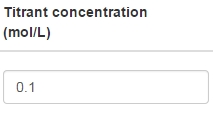
We plan to titrate with a titrant that has a concentration of 0.1 mol/L:
We click on the button “Results”:

The curve is traced:
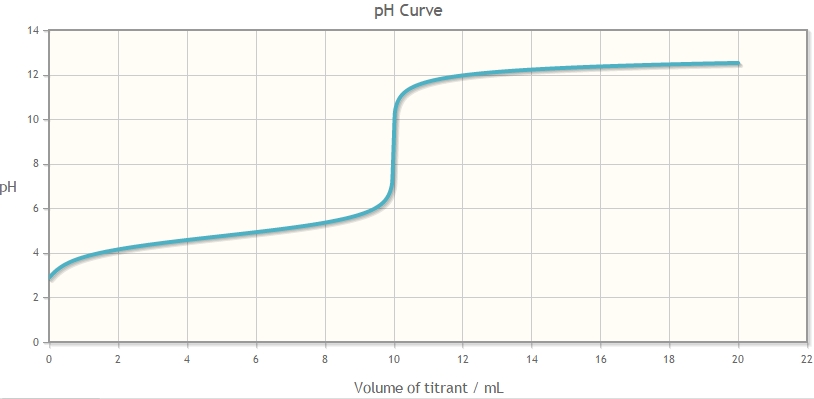
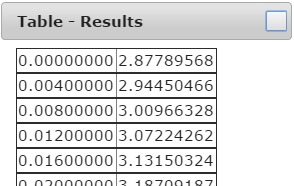
and the spreadsheet with the pH/volume values appears simultaneously.
The present web app generates a two-column spreadsheet.
The first one is the Titrant Volume.
The second one is the calculated pH during titration.
Such a speadsheet can be imported into another program, such as Microsoft Excel.
In order to trace the curve of an acid (or of a base), that is not given in the table, one has to click on the button “Add”.
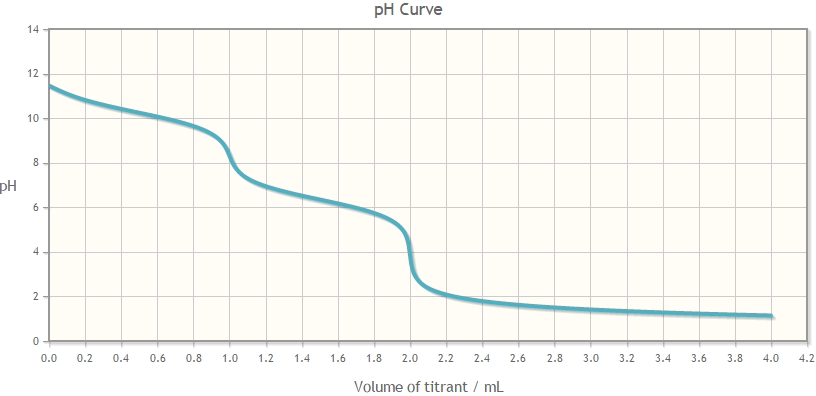
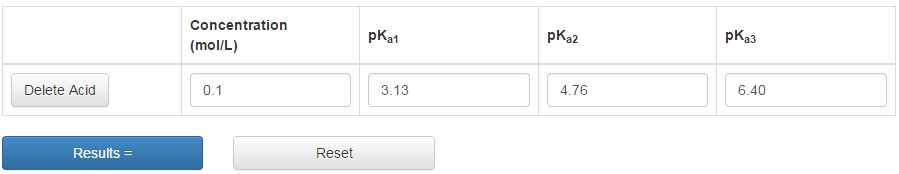
For instance, to titrate 0.1 M solution of citric acid, we will click on the button

and enter values for concentration and pK.
Here the curve obtained with 0.1 mol/L NaOH, for an added volume of NaOH 4 times larger than the volume of the analyte solution.
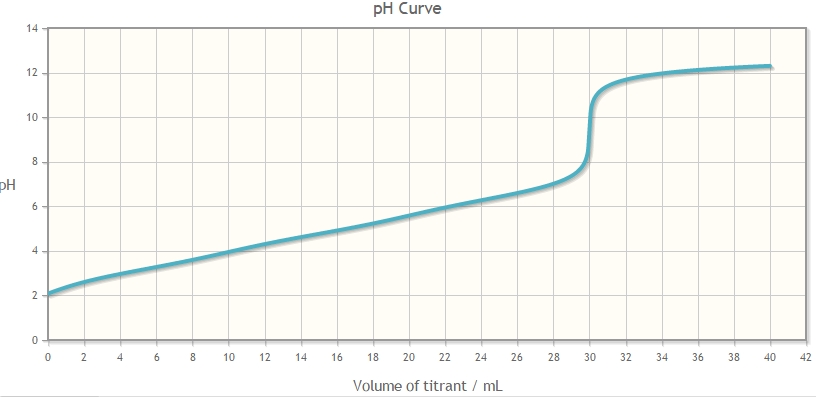
Notice that for a base, acidic pK a have to entered. Here the titration of 0.05 mol/L Na2CO3 done with 0.5 mol/L HCl.